Key Points
- London runs one of the oldest and most expensive transit systems in Europe or North America. Transport for London (TfL) prices fares by zone, not by distance.
- Distance is not what you pay for. A 14-stop journey within Zone 1 can cost less than a single stop across the Zone 1 to Zone 2 boundary. Fares turn on which zones you touch, not how far you go.
- Most comparable networks work differently. New York and Washington charge flat fares; Madrid charges by actual distance. London does neither.
- Zones 3, 4, and 5 are disproportionately BAME, and rely on public transport to get to work. The zone premium hits them hardest.
- Without objective justification, that disparate impact may be unlawful indirect discrimination under the Equality Act 2010 and/or the Human Rights Act.
- Fideres estimates excessive costs to BAME of £1.48 billion from 2010 to 2025 (piggy-backing basis, excluding injury-to-feelings), rising to roughly £2.42 billion with interest.
- In response to a Freedom of Information request submitted by Fideres, TfL confirmed that “no work has been done to explore possible changes [to] London’s fares structure, including any assessment or analysis relating to the demographics, particularly of race.”
History of the London Underground
The London Underground, managed by TfL, is the oldest underground rail system in the world, with the first line opening in January 1863.¹ In financial year 2019/20, TfL generated £4.9 billion in fare revenue, of which £2.8 billion came from the Underground alone.2
The network is now used by commuters and tourists alike, with passengers able to pay per journey or buy weekly, monthly, and annual travelcards keyed to fare zones. This was not always the case. Until 1981, tickets were priced station-to-station based on the physical distance travelled.
In 1981, the newly elected Labour administration in London introduced fare zones and subsidised TfL through Council Tax,3 with the burden falling predominantly on wealthier Londoners. The Tory-run Borough of Bromley challenged the tax in court, arguing that its residents should not pay for services they could not access (no Underground station sits within the borough).4 Bromley ultimately prevailed, forcing TfL to become self-sufficient and to raise fares by a reported 100 per cent while retaining the zone structure.5 An attempt to lower fares produced the opposite outcome. TfL later received substantial annual government grants of up to £591 million,6 which ended in 2018, and a further bailout during the COVID-19 pandemic to cover fixed costs as ridership collapsed.7
In 1983, the modern fare zones were codified. When TfL launched its first travelcard that year, Greater London was divided into 5 zones, with the City and West End forming Zone 1. Zone 5 was split in 1991 to create Zone 6. Today, TfL operates 9 zones, with the London Metropolitan Area covered entirely by Zones 1 to 6 and Zones 7 to 9 extending beyond Greater London.8
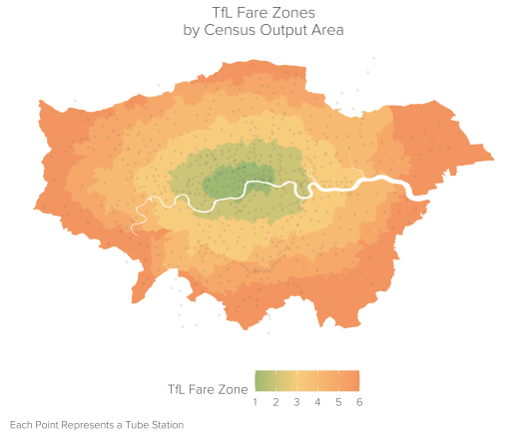
Source: Greater London Authority9 and Dooga.10
Across the six core fare zones, the price of a single peak fare into Zone 1 varies substantially, doubling between Zones 1 and 5 from £2.50 to £5.00.11
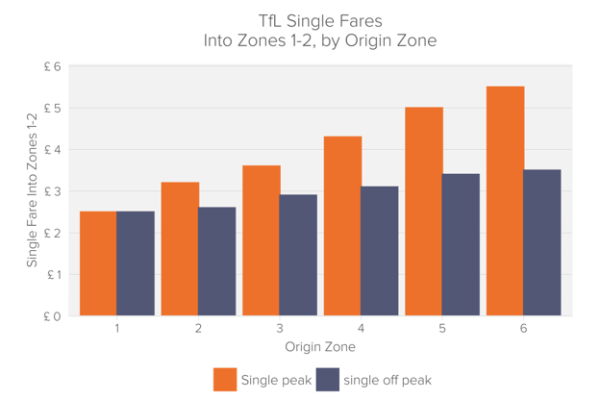
Source: Transport for London.12
The indirect consequence is that BAME commuters pay more than white commuters.13
Disparate Impact
London’s fare zones correlate with ethnicity. The share of the population that is both BAME and commutes via train, underground, metro, light rail, tram, bus, minibus, or coach14 rises steadily between Zones 1 and 4 before falling in Zones 5 and 6, with Zone 6 holding the lowest concentration of BAME public-transport commuters. Zones 3, 4, and 5 each exceed the London average.
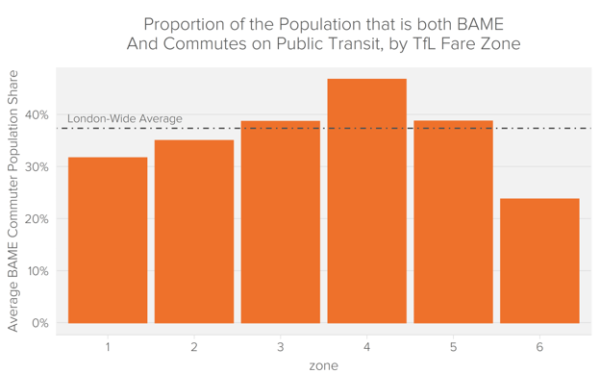
Source: NOMIS,15 Greater London Authority, and Fideres calculations.16
Zone 4 carries the highest BAME public-transport ridership. As of 2022, an annual Zones 1 to 4 travelcard cost £2,208, which is £672 above the Zones 1 to 2 price. Annually commuting from Zone 4 into Zone 1 therefore costs 43 per cent more than commuting within Zones 1 to 2 (£1,536).17
The incremental cost falls disproportionately on London’s BAME commuters. Mapped against station locations, the high-cost stations in Zones 3, 4, and 5 consistently overlap with areas holding the highest concentrations of BAME commuters.
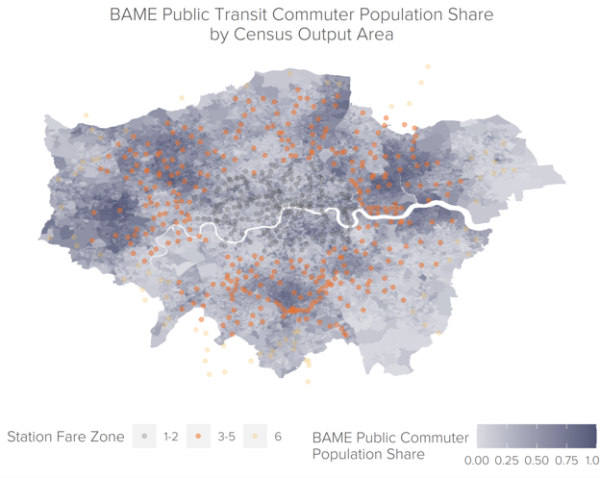
Source: NOMIS, Greater London Authority, and Fideres calculations.18
In Zones 3, 4, and 5, substantial portions of Northeast, East, South, and Northwest London contain Census Output Areas where BAME residents who commute on public transit exceed 75 per cent of the population19 Only a handful of locations in Zones 1 and 2 reach the same concentration. In Zone 4, certain Output Areas record 100 per cent non-white public commuters. In Zones 1 and 2, none do.
Put plainly, London’s fare zones have a disparate impact on ethnic minorities. Residents of Zones 3 and 4 bear the brunt of the fare structure and are disproportionately BAME. Absent a legitimate justification, TfL may be in contravention of the Equality Act 2010 and/or the Human Rights Act.
Justification
Distance-based pricing has surface appeal, but other systems show it is not required. The New York City Subway charges a single flat fare across its entire network. The NYC Subway is larger than the London Underground (1,197 km and 472 stations against London’s 420 km and 275 stations) and cheaper. A single fare costs $2.75, equivalent to £2.40 at 7 September 2022 FX, or 10 pence less than TfL’s Zones 1 to 2 fare.
New York is not anomalous. Of the largest public transit systems in the US and EU, ten charge flat fares; only three (including London) price by distance.20
| City | Ticket Type | Local Currency | Converted to USD | Network Total KM | Network Total Stations | ||
|---|---|---|---|---|---|---|---|
| London | Distance based | £ | 2.50 | $ | 2.88 | 402 | 272 |
| New York | Fixed | $ | 2.75 | $ | 2.75 | 1070 | 472 |
| Chicago | Fixed | $ | 2.50 | $ | 2.50 | 357 | 145 |
| Paris | Fixed | € | 1.90 | $ | 1.88 | 226 | 308 |
| Berlin | Distance based | € | 3.00 | $ | 2.97 | 155 | 175 |
| Los Angeles | Fixed | $ | 1.75 | $ | 1.75 | 98 | 93 |
| Milan | Fixed | € | 2.00 | $ | 1.98 | 97 | 106 |
| Athens | Fixed | € | 1.40 | $ | 1.39 | 89 | 64 |
| Rome | Fixed | € | 1.50 | $ | 1.49 | 59 | 73 |
| Brussels | Fixed | € | 2.40 | $ | 2.38 | 56 | 69 |
| Lisbon | Fixed | € | 1.50 | $ | 1.49 | 45 | 56 |
| Amsterdam | Fixed | € | 3.20 | $ | 3.17 | 43 | 39 |
| Copenhagen | Distance based | DKK | 24.00 | $ | 3.12 | 38 | 39 |
All of the fixed-fare cities except Amsterdam are cheaper than TfL. The disparate impact on BAME commuters is therefore unnecessary and, on this comparator evidence, unjustified.
On TfL’s own numbers, the Underground generated £2.8 billion in fare revenue from 1.3 billion passenger journeys in 2019/20, an average yield of £2.04 per journey.21For an annual Zones 1 to 4 Travelcard at £2,208 to break even at £2.04 per journey, the holder would need 1,082 trips, or three per day. For Zones 1 to 5 at £2,628,22 the figure rises to 1,288 trips, or 3.5 per day. A single peak fare from Zone 4 into Zone 1 is £4.30; from Zone 5 it is £5.00.
In the same year, TfL spent £2.3 billion (£1.74 per journey) operating the Underground, yielding net income of £439 million.23 The Underground does not merely break even; it generated nearly half a billion pounds of profit. There is no operating-cost rationale for charging BAME commuters more than double the average fare and nearly triple the break-even fare. One caveat: TfL has faced material financial pressure since COVID-19.
Until recently, TfL received government funding of more than £500 million per year. In 2013, the government set a self-sufficiency target,24 and in 2020 it provided a £1.6 billion pandemic bailout25 Setting the bailout aside, TfL is now the only major transport system in Western Europe that receives no operating grant.26 Any cost-based justification needs to be assessed against that funding history.
Fideres submitted a Freedom of Information request to TfL asking what analysis, if any, had been done on the distributional effects of the zonal fare structure. TfL responded that it holds no such information, because there are no plans to change a zonal system it shares with National Rail, and any revision would have to be made jointly with the Rail Delivery Group and the Department for Transport. On that basis, TfL confirmed that “no work has been done to explore possible changes [to] London’s fares structure, including any assessment or analysis relating to the demographics, particularly of race.”
Estimate of the Excessive Cost
To estimate the excessive cost per-claimant, Fideres takes the difference in price between a Zones 1 to 2 travelcard and travelcards covering Zones 1 to 3, 1 to 4, and 1 to 5 in each year, for monthly and annual travelcards. Because TfL’s break-even fare sits well below the Zones 1 to 2 price, this is a conservative quantum.
Between 2015 and 2023, a Zones 1 to 3 travelcard was 15 per cent more expensive than Zones 1 to 2, rising to 30 per cent for Zones 1 to 4 and 41 per cent for Zones 1 to 5, for both monthly and annual products.27
| Monthly Travelcard | Fares | Overcharge | |||||
|---|---|---|---|---|---|---|---|
| 12 | 123 | 1234 | 12345 | 123 | 1234 | 12345 | |
| 2010 | £123 | £145 | £177 | £210 | 15% | 30% | 41% |
| 2011 | £123 | £145 | £177 | £210 | 15% | 30% | 41% |
| 2012 | £123 | £145 | £177 | £210 | 15% | 30% | 41% |
| 2013 | £123 | £145 | £177 | £210 | 15% | 30% | 41% |
| 2014 | £123 | £145 | £177 | £210 | 15% | 30% | 41% |
| 2015 | £123 | £145 | £177 | £210 | 15% | 30% | 41% |
| 2016 | £125 | £146 | £179 | £212 | 15% | 30% | 41% |
| 2017 | £127 | £149 | £182 | £216 | 15% | 30% | 41% |
| 2018 | £131 | £154 | £188 | £224 | 15% | 30% | 41% |
| 2019 | £135 | £158 | £194 | £230 | 15% | 31% | 41% |
| 2020 | £139 | £163 | £199 | £237 | 15% | 30% | 41% |
| 2021 | £142 | £167 | £204 | £243 | 15% | 30% | 42% |
| 2022 | £148 | £174 | £212 | £252 | 15% | 30% | 42% |
| 2023 | £156 | £184 | £225 | £267 | 15% | 30% | 42% |
| 2024 | £156 | £184 | £225 | £267 | 15% | 30% | 42% |
| 2025 | £156 | £184 | £225 | £267 | 15% | 30% | 42% |
| Annual Travel Card | Fares | Overcharge | |||||
|---|---|---|---|---|---|---|---|
| 12 | 123 | 1234 | 12345 | 123 | 1234 | 12345 | |
| 2010 | £1,284 | £1,508 | £1,844 | £2,188 | 15% | 30% | 41% |
| 2011 | £1,284 | £1,508 | £1,844 | £2,188 | 15% | 30% | 41% |
| 2012 | £1,284 | £1,508 | £1,844 | £2,188 | 15% | 30% | 41% |
| 2013 | £1,284 | £1,508 | £1,844 | £2,188 | 15% | 30% | 41% |
| 2014 | £1,284 | £1,508 | £1,844 | £2,188 | 15% | 30% | 41% |
| 2015 | £1,284 | £1,508 | £1,844 | £2,188 | 15% | 30% | 41% |
| 2016 | £1,296 | £1,520 | £1,860 | £2,208 | 15% | 30% | 41% |
| 2017 | £1,320 | £1,548 | £1,892 | £2,248 | 15% | 30% | 41% |
| 2018 | £1,364 | £1,600 | £1,960 | £2,328 | 15% | 30% | 41% |
| 2019 | £1,404 | £1,648 | £2,020 | £2,400 | 15% | 30% | 42% |
| 2020 | £1,444 | £1,696 | £2,076 | £2,468 | 15% | 30% | 41% |
| 2021 | £1,480 | £1,740 | £2,128 | £2,532 | 15% | 30% | 42% |
| 2022 | £1,536 | £1,808 | £2,208 | £2,628 | 15% | 30% | 42% |
| 2023 | £1,628 | £1,916 | £2,340 | £2,784 | 15% | 30% | 42% |
| 2024 | £1,628 | £1,916 | £2,340 | £2,784 | 15% | 30% | 42% |
| 2025 | £1,628 | £1,916 | £2,340 | £2,784 | 15% | 30% | 42% |
To calculate aggregate costs, the per-claimant quantum is applied to the total number of monthly and annual travelcards sold for Zones 1 to 3, 1 to 4, and 1 to 5, excluding single tickets and weekly travelcards. TfL provided this data for financial years 2015/16 through 2022/23 in response to a Freedom of Information request. For pre-2015 seasons, sales are held flat at 2015/16 values. For 2023/24 to 2025, values are projected using a linear time trend by travelcard type and zone combination.
On monthly and annual travelcards alone (excluding weekly and pay-as-you-go), Fideres estimates that TfL’s zone-variable fare structure has cost commuters in Zones 3 to 5 an additional £1.48 billion from 2010 to 2025. Including interest, this rises to approximately £2.42 billion.28 Both figures exclude any Vento (injury-to-feelings) award.
| Monthly Travel Cards | Travelcards Sold | Total Damages | ||||
|---|---|---|---|---|---|---|
| 123 | 1,234 | 12,345 | 123 | 1234 | 12345 | |
| 2010 | 1,084,579 | 493,693 | 239,892 | £23.32 M | £26.56 M | £20.82 M |
| 2011 | 1,084,579 | 493,693 | 239,892 | £23.32 M | £26.56 M | £20.82 M |
| 2012 | 1,084,579 | 493,693 | 239,892 | £23.32 M | £26.56 M | £20.82 M |
| 2013 | 1,084,579 | 493,693 | 239,892 | £23.32 M | £26.56 M | £20.82 M |
| 2014 | 1,084,579 | 493,693 | 239,892 | £23.32 M | £26.56 M | £20.82 M |
| 2015 | 1,084,579 | 493,693 | 239,892 | £23.32 M | £26.56 M | £20.82 M |
| 2016 | 1,015,528 | 481,908 | 230,910 | £21.83 M | £26.07 M | £20.20 M |
| 2017 | 897,340 | 430,203 | 205,042 | £19.65 M | £23.62 M | £18.27 M |
| 2018 | 811,809 | 395,682 | 184,383 | £18.35 M | £22.63 M | £17.06 M |
| 2019 | 707,441 | 337,451 | 158,244 | £16.62 M | £19.98 M | £15.13 M |
| 2020 | 228,374 | 108,681 | 50,302 | £5.53 M | £6.59 M | £4.94 M |
| 2021 | 137,619 | 66,472 | 30,027 | £3.44 M | £4.13 M | £3.03 M |
| 2022 | 276,673 | 132,046 | 61,792 | £7.22 M | £8.52 M | £6.48 M |
| 2023 | 556,234 | 262,308 | 127,160 | £15.41 M | £17.94 M | £14.11 M |
| 2024 | 1,118,272 | 521,073 | 261,679 | £30.98 M | £35.64 M | £29.05 M |
| 2025 | 2,248,214 | 1,035,109 | 538,503 | £62.28 M | £70.80 M | £59.77 M |
| Total | 14,504,976 | 6,733,089 | 3,287,393 | £341 M | £395 M | £313 M |
| Annual Travelcards | Travelcards Sold | Total Damages | ||||
|---|---|---|---|---|---|---|
| 123 | 1,234 | 12,345 | 123 | 1234 | 12345 | |
| 2010 | 41,052 | 27,760 | 17,535 | £9.20 M | £15.55 M | £15.85 M |
| 2011 | 41,052 | 27,760 | 17,535 | £9.20 M | £15.55 M | £15.85 M |
| 2012 | 41,052 | 27,760 | 17,535 | £9.20 M | £15.55 M | £15.85 M |
| 2013 | 41,052 | 27,760 | 17,535 | £9.20 M | £15.55 M | £15.85 M |
| 2014 | 41,052 | 27,760 | 17,535 | £9.20 M | £15.55 M | £15.85 M |
| 2015 | 41,052 | 27,760 | 17,535 | £9.20 M | £15.55 M | £15.85 M |
| 2016 | 38,519 | 26,493 | 15,671 | £8.63 M | £14.94 M | £14.29 M |
| 2017 | 34,469 | 24,068 | 14,819 | £7.86 M | £13.77 M | £13.75 M |
| 2018 | 31,076 | 21,709 | 13,610 | £7.33 M | £12.94 M | £13.12 M |
| 2019 | 27,576 | 19,107 | 12,045 | £6.73 M | £11.77 M | £12.00 M |
| 2020 | 9,023 | 6,250 | 3,844 | £2.27 M | £3.95 M | £3.94 M |
| 2021 | 3,676 | 2,565 | 1,522 | £0.96 M | £1.66 M | £1.60 M |
| 2022 | 4,510 | 3,151 | 1,979 | £1.23 M | £2.12 M | £2.16 M |
| 2023 | 5,534 | 3,870 | 2,573 | £1.59 M | £2.76 M | £2.97 M |
| 2024 | 6,790 | 4,753 | 3,346 | £1.96 M | £3.38 M | £3.87 M |
| 2025 | 8,331 | 5,839 | 4,351 | £2.40 M | £4.16 M | £5.03 M |
| Total | 415,815 | 284,364 | 178,969 | £96 M | £165 M | £168 M |
| Grand Total: | £1.48 B | |||||
The headline figure assumes the viability of a piggy-backing claim. BAME commuters constitute 40 to 45 per cent of the population in Zones 3, 4, and 5. Limiting the claim to BAME commuters reduces the size of the excessive cost by roughly half to £1.1 billion, again before Vento.29 Injury-to-feelings could materially increase any award.
A claim would likely need to be brought against the Mayor of London’s office, either alone or alongside TfL. TfL may recommend fare increases, but the Mayor approves them.30
Conclusion
The Underground is a symbol of London, yet its fare-setting system levies the highest fees on its ethnic-minority commuters. Across Europe and the United States, distance-based zones are the exception, not the rule, even in cities with larger networks. Without a clear and defensible justification, the zone structure is properly viewed as indirect discrimination and a violation of the UK’s civil rights protections.
Sources
1 London Underground – Transport for London
2 How we are funded – Transport for London, TfL Annual Report 2019/20, p. 73.
3 mylondon.news/news/nostalgia/how-first-london-underground-zones-22051911.
4 mylondon.news/news/news-opinion/bromley-needs-london-underground-station-17700941.
5 Ibid.
6 bbc.co.uk/news/uk-england-london-34923879.
8 Ibid.
9 data.london.gov.uk/dataset/mylondon.
11 tfl.gov.uk/fares/find-fares/tube-and-rail-fares/single-fare-finder.
12 Ibid.
13 This assumes that BAME commuters are equally likely as white commuters to commute from Zones 3, 4, or 5 into Zones 1 or 2.
14 Measured at the Census Output Area as of the 2011 Census. Output Areas are the smallest unit of measurement publicly released for the UK census and cover around 125 households. The London Metropolitan Area contains over 25,000 Output Areas.
16 Figures averaged across Census Output Areas for each zone.
17 tfl.gov.uk/campaign/new-fares.
18 Each point represents a tube station, coloured according to its fare zone.
19 Measured at the Census Output Area level.
20 Currencies converted at FX rates as of 7 September 2022.
21 TfL Annual Report 2019/20, p. 73. The £2.04 figure is below the base fare of £2.50 partly because of Travelcards and concessions.
22 tfl.gov.uk/campaign/new-fares.
23 TfL Annual Report 2019/20, p. 96.
24 bbc.co.uk/news/uk-england-london-34923879.
25 ft.com/content/70d657d5-2c48-430f-86bf-8badcd37d80a.
26 Ibid.
27 Travelcard pricing for 2010 to 2014 is not readily available; we assume fares equal their 2015 values for that period.
28 Interest calculated following the method described by Citizens Advice (citizensadvice.org.uk).
29 Assuming BAME commuters are equally likely to commute into Zones 1 to 2 and to buy an annual travelcard.
30 Mayor outlines details of TfL fare changes from March 2022 | London City Hall