
Key Points
- Redlining, denying or limiting credit to neighborhoods because of who lives in them, persists decades after it was outlawed. In the New York-Newark-Jersey City MSA, majority Black-Hispanic neighborhoods hold 35% of the population, but they receive only 18% of mortgage originations.
- While the DOJ’s Combating Redlining Initiative secured over $153 million across more than fifteen settlements, courts have since granted early termination of several redlining consent orders.
- To research disparities in mortgage access, Fideres has built a screening tool that produces a scorecard benchmarking any US mortgage lender against its market peers using public Home Mortgage Disclosure Act (HMDA),1 Census, and branch data.
- When run on America’s largest mortgage market, our research tool flagged multiple lenders as “high risk” (i.e. whose lending patterns diverge materially from those of their peers). Two examples illustrate our approach:
- one whose gaps are visible on the face of its scorecard.
- one that looks fair at tract level, yet made only 0.8% of its loans in majority Black-Hispanic neighborhoods to Black or Hispanic borrowers, against 50.8% for its peers.
- While a scorecard does not establish liability, it identifies lending patterns that may be associated with discrimination and where closer analysis would be informative.
The Modern Redlining Risk
What Redlining Is and How It Has Evolved
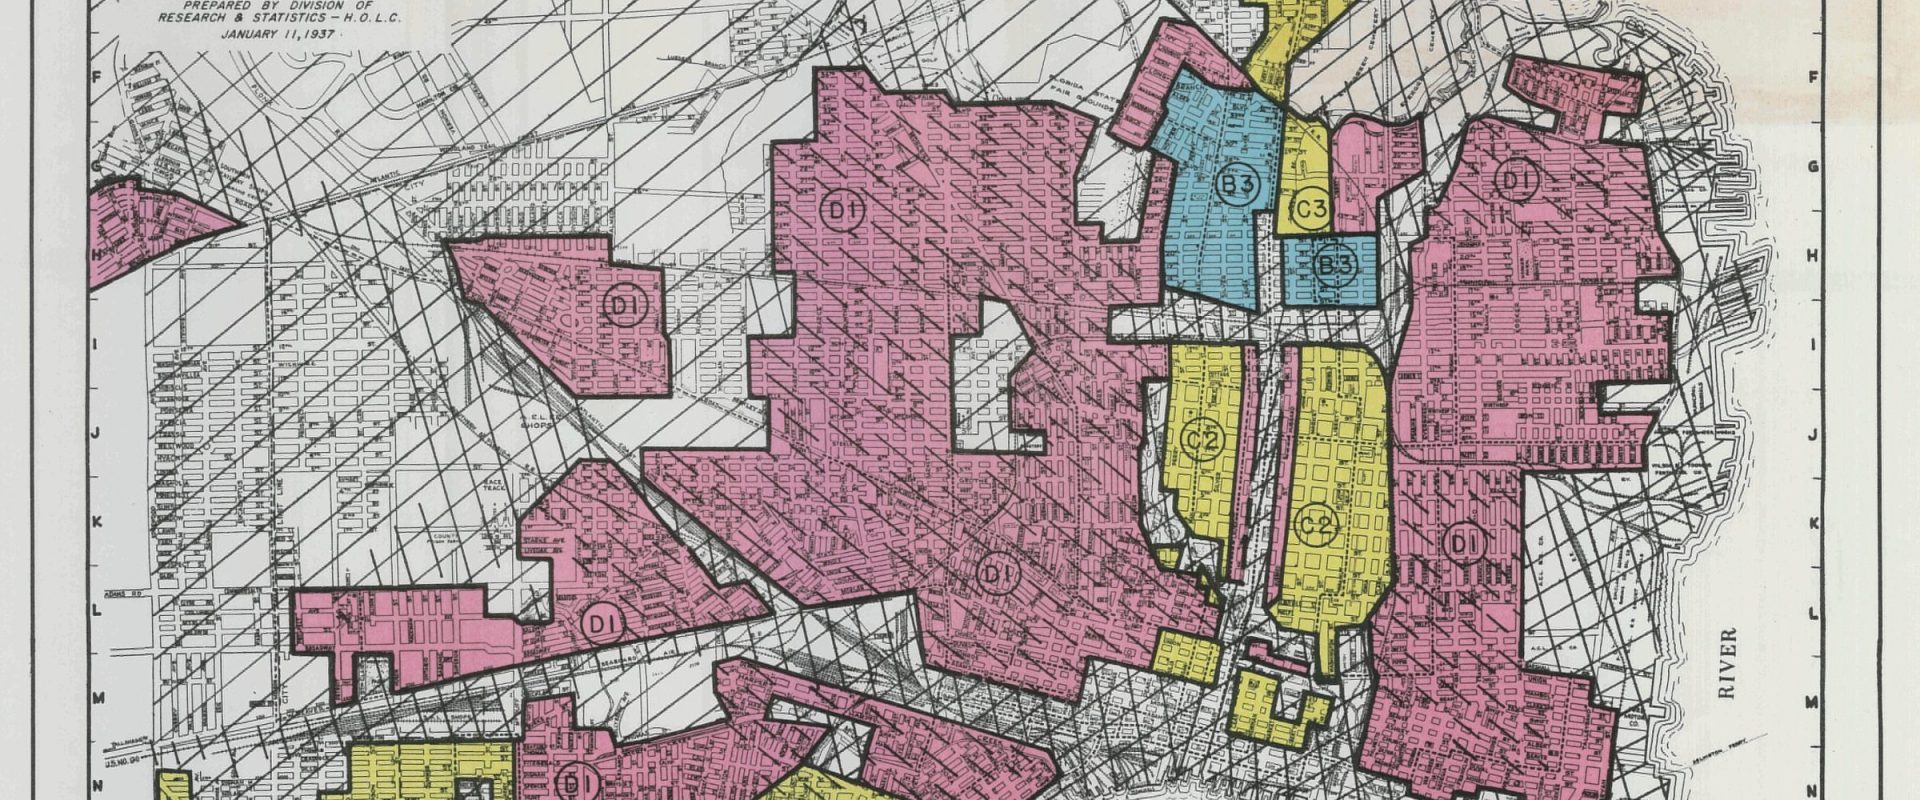
The term ‘redlining’ dates back to the 1930s, when federal housing maps literally drew red lines around minority neighborhoods, marking them “hazardous”, and lenders simply refused to make loans within those lines.2 Redlining is therefore a form of housing discrimination that involves denying or limiting credit to neighborhoods based on the race or ethnicity of the people who live there.3 Congress outlawed the practice through the Fair Housing Act of 1968 (FHA) and the Equal Credit Opportunity Act (ECOA). Despite this, lending disparities persist.4 According to the Consumer Financial Protection Bureau (CFPB):
- Denial rates were 16.6% for Black applicants and 12.0% for Hispanic-White applicants, versus 5.8% for non-Hispanic White applicants, a ratio of approximately three to one.
- Black and Hispanic-White borrowers received just 8.2% and 9.9% of conventional home purchase loans, respectively.5
Modern redlining has evolved from the paper maps of the 1930s. Lenders rarely refuse credit outright in a given neighborhood. Instead, they underserve minority communities by offering little credit to them.6 This can happen through unequal access to mortgage credit in majority-minority neighborhoods through more limited marketing, fewer branches, loan officers, applications, and loans, compared to similar lenders in the same market.
The enforcement record demonstrates this disparity at scale. The Department of Justice’s (DOJ) Combating Redlining Initiative,7 launched in October 2021, ultimately secured over $153 million in relief across more than fifteen settlements (as of February 2025),8 including the first cases against non-depository mortgage companies. At its peak, the DOJ reported more than two dozen active redlining investigations.9 The New York-Newark-Jersey City Metropolitan Statistical Area (MSA), which we analyze in this Research Alert, has seen two recent cases directly:
- In 2022, Lakeland Bank10 paid roughly $13 million to resolve allegations that it failed to serve majority-Black and Hispanic neighborhoods in the Newark area (i.e., Essex, Somerset, and Union Counties).
- In 2024, OceanFirst Bank11 committed over $15 million to resolve similar allegations in Middlesex, Monmouth, and Ocean Counties.
While federal posture has since shifted, with courts granting early termination of several redlining consent orders during 2025,12 state regulators, private fair-housing organizations and community groups also play a role in scrutinizing lenders. For instance, New York’s Department of Financial Services (DFS) enforces its own fair-lending law, which reaches nonbank lenders13 DFS analyzed HMDA mortgage data from 2016–2019 in the Buffalo MSA and found that lenders (particularly non-depository institutions) originated disproportionately few loans in majority-minority neighborhoods and to minority borrowers, leading DFS to recommend extending New York’s Community Reinvestment Act (CRA) to cover non-depository mortgage lenders14
Using Public Datasets to Screen for Redlining
Redlining cases are built almost entirely on the lender’s own HMDA data, joined to Census demographics and benchmarked against peers. The questions we ask the data are specific:
- Does the lender receive applications and make loans in majority-minority neighborhoods at rates far below comparable lenders in the same market?
- Do the applications it does receive fare worse?
- And do the gaps persist across years and neighborhoods in a way that chance cannot explain?
Credit Access Radar
Fideres has developed a tool we call Credit Access Radar (CAR), which draws entirely on public data, HMDA loan-level filings, Census demographics, and bank branch locations, to benchmark U.S. mortgage lenders against similarly sized lenders active in the same market: their “peers.”15
For each lender, CAR produces a scorecard of seven tests across three dimensions:
- Credit access (the share of the lender’s originations reaching majority-minority neighborhoods16, how its lending concentrates across neighborhoods, and how near its branches are).
- Outcomes (how often applications from those neighborhoods are denied, converted to closed loans, or withdrawn).
- Pricing (the incidence rate of higher-priced loans).
A CAR scorecard is a triage instrument. Each test compares the lender’s figure against its comparator peers and asks whether the gap is statistically significant; each is then flagged low, medium, or high risk, and the flags roll up into an overall risk rating.
CAR in Action
To show an example of this methodology in action, Fideres ran CAR on lenders active in the urban core of the New York–Newark–Jersey City metropolitan area, the country’s largest mortgage market.
The New York-Newark-Jersey City MSA Up Close
The New York-Newark-Jersey City (NY-NJ) MSA spans twenty-two counties, roughly 4,900 census tracts, and 19.7 million residents. Figure 1 shows that the Majority Black-Hispanic (MBH) tracts17 are concentrated in the Bronx, upper Manhattan, central Brooklyn, southeast Queens, Newark and its urban ring, Paterson, Elizabeth, and New Brunswick.
Figure 1: Census tracts by Black and Hispanic population share, New York-Newark-Jersey City MSA (ACS 2019-2023).
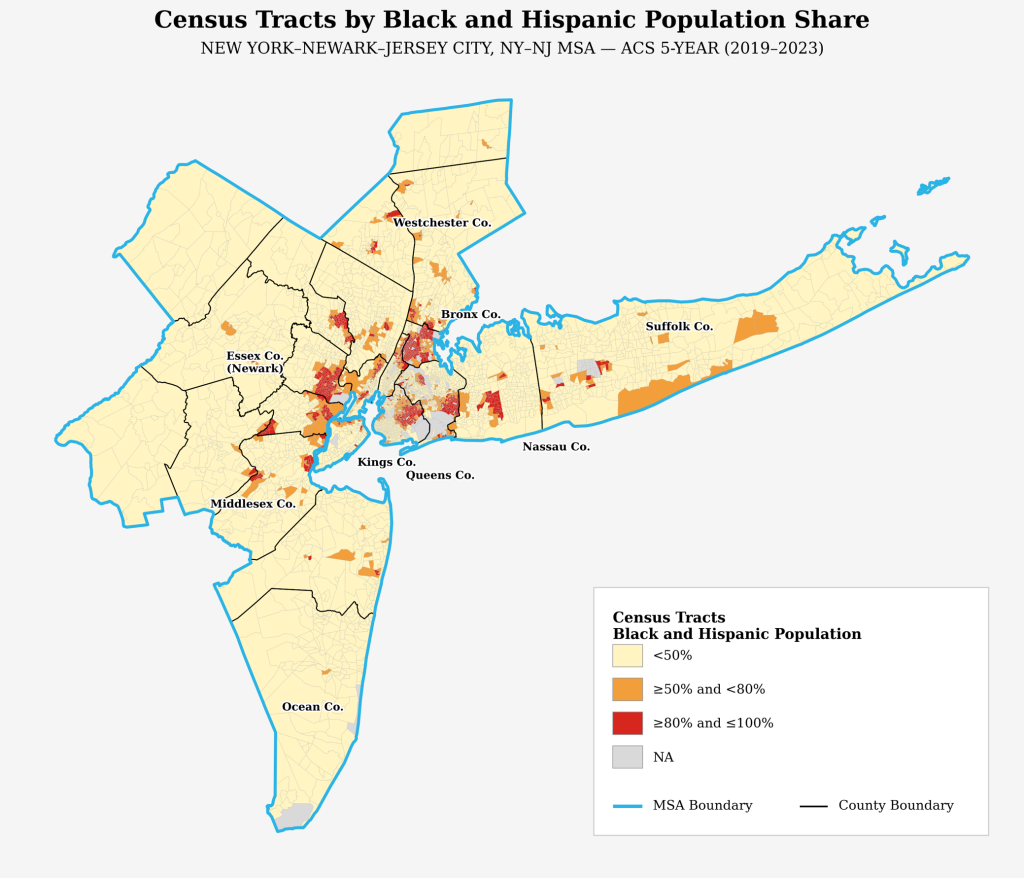
Table 1 shows that 35% of the MSA’s population lives in Majority Black-Hispanic tracts and more than half the population lives in tracts where non-White residents of any group form the majority.
We applied the market methodology to the MSA for 2022-202418 That dataset comprises more than 762,000 applications and 461,000 originations totaling roughly $261 billion,19spread across more than 1,000 active lenders.
Table 1: Market-wide HMDA activity, 2022-2024. Denial rate = denials / (originations + denials). Sources: HMDA, ACS 2019-2023.
| Tract group (ACS 2019-2023) | Percent of tracts | Percent of population | Percent of originations | Denial rate |
|---|---|---|---|---|
| Majority Black-Hispanic (≥50%) | 35.2% | 35.3% | 18.1% | 25.5% |
| - of which ≥80% Black-Hispanic | 18.0% | 17.8% | 7.3% | 29.6% |
| Majority-minority, any group (≥50% non-White) | 53.7% | 53.2% | 34.1% | 21.9% |
| All other tracts (<50% Black-Hispanic) | 64.8% | 64.7% | 81.9% | 14.5% |
Sources: HMDA, ACS 2019-2023.
Three patterns stand out:
- First, an access gap: Majority Black-Hispanic tracts hold 35% of the MSA’s population. They receive only 18% of its mortgage originations, about half of population parity (see Table 1). In the most concentrated tracts (≥80% Majority Black-Hispanic), the ratio falls to two-fifths.
- Second, an outcome gap: applications from Majority Black-Hispanic tracts are denied at 25.5% versus 14.5% elsewhere (see Table 1). Black applicants across the MSA face a higher denial rate of 27.8% versus 13.1% for non-Hispanic White applicants, approximately a two-to-one ratio.
- Third, a pricing gap: 5.3% of originations in Majority Black-Hispanic tracts were higher-priced (HPML) loans, versus 3.1% in the rest of the market.
Two Lenders in the New York-Jersey City-White Plains Division
Fideres ran CAR against two lenders in this market. We refer to them in this note as Lender A and Lender B. The scorecards below show CAR outputs for two depository institutions20 screened in the New York-Jersey City-White Plains, NY-NJ metropolitan division21 over a five-year window (2020-2024).
As shown in Table 2, Lender A displays the pattern at the heart of most redlining cases. The lender is active in the market. Its credit does not reach majority Black-Hispanic neighborhoods:
- Only 10.1% of its 2,517 originations went to Majority Black-Hispanic tracts, against a 23.4% average among its 109 peers. The results imply that 94 of the 109 competitors lend to a larger share of originations22, placing it at the 14th percentile of its peer group and implying a shortfall of roughly 330 loans over the window.23
- Applications from Majority Black-Hispanic tracts also face denials at 38.0% against a 22.4% peer benchmark, almost twice the peer rate, and are converted to closed loans at 44.3% versus 52.5%.
More favorable pricing and branch-coverage results do not offset the access gap. The tool returns high-risk flags on two metrics and an overall high-risk rating.
Table 2: Screening scorecard, “Lender A,” a large national depository. “n.s.” = not statistically significant.
| Screening test (Majority Black-Hispanic "MBH" tracts) | Lender A | Peer benchmark | Significance | Flag |
|---|---|---|---|---|
| Origination share in MBH tracts | 10.1% | 23.4% | <1% | HIGH RISK |
| Denial rate in MBH tracts | 38.0% | 22.4% | <1% | MEDIUM RISK |
| Higher-priced (HPML) share in MBH tracts | 0.0% | 5.9% | <1% | LOW RISK |
| Branch within 5 miles: MBH vs. other tracts | 54.6% | 49.5% | n.s. | LOW RISK |
| Application-to-origination conversion, MBH tracts | 44.3% | 52.5% | <1% | MEDIUM RISK |
| Withdrawn / incomplete share, MBH tracts | 26.5% | 27.1% | n.s. | LOW RISK |
| Concentration of lending in MBH tracts | 9.3% | 22.3% | Yes | HIGH RISK |
| OVERALL | HIGH RISK |
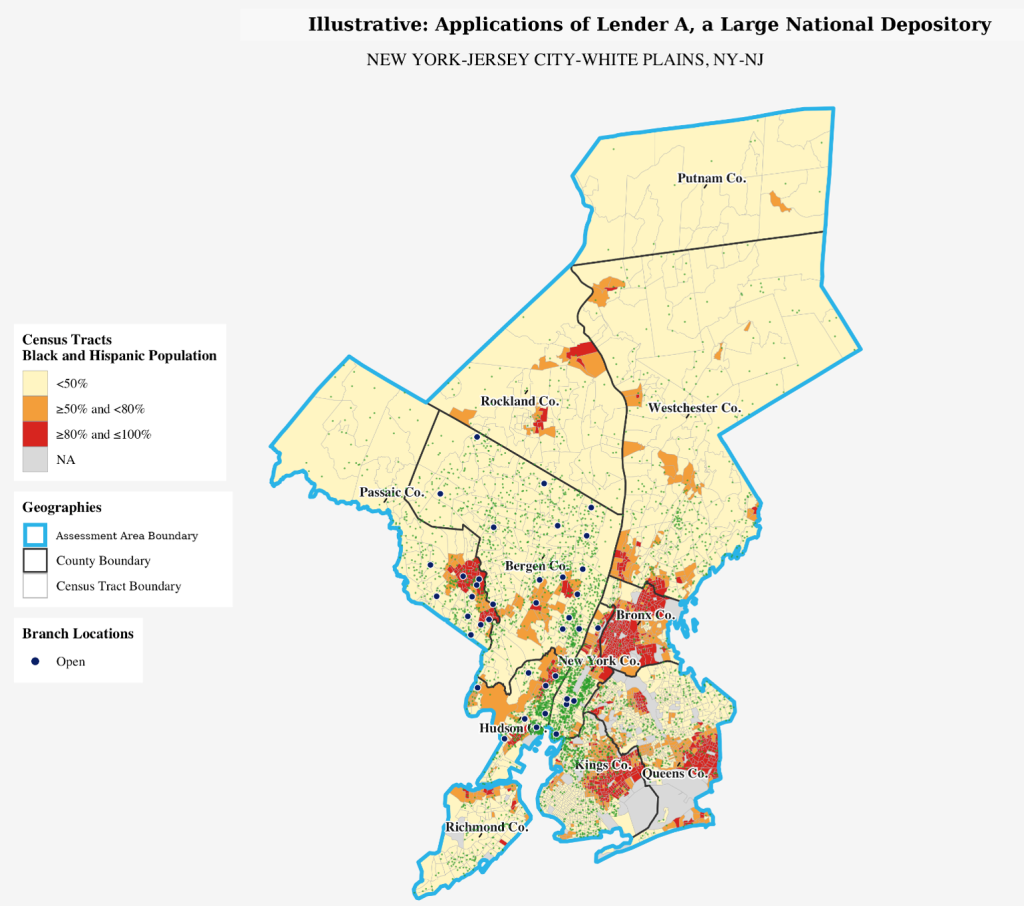
Figure 2 plots Lender A’s applications. Activity clusters in the lighter, majority-white tracts. Coverage of Majority Black-Hispanic tracts is sparser, including where branches are nearby. Lender A has a substantial branch presence in the division. Few open branches sit in MBH tracts (dark-blue dots). The applications it received over the period (green dots) are sparse in MBH tracts (orange and red on the map).
Figure 2: Application density map for Lender A (one dot per application; branch locations overlaid), New York-Jersey City-White Plains MSA.
The results for Lender B require more careful scrutiny. As shown in Table 3:
- Some outcome measures look favorable at first glance. In Black and Hispanic neighborhoods, just 11.4% of loan applications are denied, less than half the 22.7% rate among similar lenders. These applications also get approved and funded more often, 74.1% versus 51.9% elsewhere, and are far less likely to be withdrawn by the applicant before a decision is made, 10.3% compared to 27.5%.
- In total the bank makes far fewer loans in Black and Hispanic neighborhoods than its peers do. It originates only 11% of loans there, compared to a 22% average among similar banks, placing it below 78% of the 141 banks in its peer group. It also has far fewer branches in these neighborhoods: less than half (46.7%) are within five miles of a branch, compared to 62.6% elsewhere.
Table 3: Screening scorecard, “Lender B,” a mid-sized regional depository.
| Screening test (Majority Black-Hispanic "MBH" tracts) | Lender B | Peer benchmark | Significance | Flag |
|---|---|---|---|---|
| Origination share in MBH tracts | 11.0% | 22.1% | <1% | HIGH RISK |
| Denial rate in MBH tracts | 11.4% | 22.7% | n.s. | LOW RISK |
| Higher-priced (HPML) share in MBH tracts | 0.0% | 5.9% | <1% | LOW RISK |
| Branch within 5 miles: MBH vs. other tracts | 46.7% | 62.6% | Yes | MEDIUM RISK |
| Application-to-origination conversion, MBH tracts | 74.1% | 51.9% | <1% | LOW RISK |
| Withdrawn / incomplete share, MBH tracts | 10.3% | 27.5% | <1% | LOW RISK |
| Concentration of lending in MBH tracts | 7.7% | 21.9% | Yes | HIGH RISK |
| OVERALL | HIGH RISK |
The scorecard alone does not explain why these results occur, even where every application is treated fairly. Of Lender B’s 132 loans in Black and Hispanic neighborhoods, one went to a Black or Hispanic borrower. Similar lenders made 11,485 such loans, of which 50.8% went to Black or Hispanic borrowers, against 45.3% across the industry.24
Lender B’s activity in majority Black-Hispanic neighborhoods is not equivalent to serving those neighborhoods’ residents. Its lending to Black and Hispanic borrowers within these areas falls well short of peer levels, indicating that overall neighborhood-level lending volume conceals a shortfall in lending to the demographic groups that constitute the neighborhood. A tract-level scorecard cannot show that on its face. Breaking tract-level access down by borrower race exposes it. Lender A’s risk is visible on the scorecard. Lender B’s emerges only from that second step.
Interpreting a Flag
The gaps we identify provide context rather than direct evidence. They may reflect demand, wealth, and credit-profile differences as much as lender conduct. They set the baseline every lender in the market is measured against. The question then becomes lender-specific: does this institution fall materially below that baseline, relative to its peers, in a pattern that statistics cannot dismiss as chance?
When a flag appears, the investigation path is well defined:
- Analyze the underlying mechanisms causing these disparities.
- Test statistical robustness under alternative sensitivity analyses (e.g., alternative geographic borders or different peer group definitions).
- Where needed, use multivariate regression models that control for applicant credit characteristics and demand-side factors (e.g., mortgage-ready households).
Data screening alone does not prove unlawful discrimination. Legitimate factors may explain a statistical anomaly or flag, and a lender is entitled to show them. It does, however, identify lenders whose lending patterns diverge materially from those of their peers. Such patterns may be indicative of violations of the FHA and ECOA and in these instances, closer analysis would be informative.
Sources
1 HMDA was originally enacted by Congress in 1975 and is implemented by Regulation C, 12 CFR part 1003. The FFIEC has played a central role in implementing HMDA since 1980 and it continues to do so today. On July 21, 2011, the rule-writing authority of Regulation C was transferred to the Consumer Financial Protection Bureau (CFPB). https://www.ffiec.gov/data/hmda
2 Rothstein, R. 2017. The Color of Law: A forgotten history of how our government segregated America. New York: Liveright Publishing Corporation.
3 The National Community Reinvestment Coalition (NCRC) defines redlining as “…the practice of denying borrowers access to credit based on the location of properties in minority or economically disadvantaged neighborhoods.” https://ncrc.org/wp-content/uploads/dlm_uploads/2018/02/NCRC-Research-HOLC-10.pdf
4 https://www.federalreservehistory.org/essays/redlining
5 CFPB, Summary of 2023 Data on Mortgage Lending (2024), https://www.consumerfinance.gov/data-research/hmda/summary-of-2023-data-on-mortgage-lending/ (retrieved Jul. 23, 2026).
6 Glantz, A., & Martinez, E. (2018, February 15). For people of color, banks are shutting the door to homeownership. Reveal. https://revealnews.org/article/for-people-of-color-banks-are-shutting-the-door-to-homeownership/
7 U.S. Department of Justice, Justice Department Announces New Initiative to Combat Redlining, press release (Oct. 22, 2021), justice.gov/archives/opa/pr/justice-department-announces-new-initiative-combat-redlining.
8 U.S. Department of Justice, The Mortgage Firm Settlement (the Initiative’s sixteenth), press release (Jan. 7, 2025), stating the Department “has secured over $153 million in relief,” justice.gov/usao-sdfl/pr/justice-department-secures-third-settlement-non-depository-mortgage-company-resolve (retrieved Jul. 23, 2026).
9 U.S. Department of Justice, press release (Oct. 19, 2023): $107 million across the Initiative’s first ten settlements; more than two dozen active investigations, https://www.justice.gov/archives/opa/pr/justice-department-reaches-significant-milestone-combating-redlining-initiative-after.
10 U.S. Department of Justice (D.N.J.), press release (Sept. 28, 2022): $13.15 million total ($12 million loan-subsidy fund, $750,000 advertising/outreach/education, $400,000 community partnerships); Essex, Somerset, and Union Counties, N.J.; conduct alleged 2015-2021, justice.gov/archives/opa/pr/justice-department-secures-agreement-lakeland-bank-address-discriminatory-redlining (retrieved Jul. 23, 2026).
11 U.S. Department of Justice, press release (Sept. 18, 2024): over $15 million (at least $14 million loan-subsidy fund, $700,000 advertising/outreach, $400,000 community partnerships); Middlesex, Monmouth, and Ocean Counties, N.J.; conduct alleged 2018-2022, https://www.justice.gov/archives/opa/pr/justice-department-and-department-housing-and-urban-development-secure-over-15m-oceanfirst (retrieved Jul. 23, 2026).
12 Protect Borrowers, Consumer Federation of America, & Americans for Financial Reform Education Fund. (2026, July 13). CFPB enforcement actions dismissed or terminated under Trump’s CFPB [Memorandum]. https://protectborrowers.org/wp-content/uploads/2025/10/CFPB-Pending-Enforcement-Actions-Memo.pdf. National Mortgage News, DOJ Quietly Axes More Redlining Settlements with Lenders (2025): consent orders terminated for Ameris Bank, Cadence Bank, Patriot Bank, Trident Mortgage, and Trustmark National Bank. See for example, https://storage.courtlistener.com/recap/gov.uscourts.paed.599104/gov.uscourts.paed.599104.17.0.pdf
13 N.Y. Exec. Law § 296-a; N.Y. Dept. of Fin. Servs., Industry Letter on the New York State Fair Lending Law (Apr. 22, 2026); NYDFS 2021 redlining inquiry report and fair-lending agreement with a nonbank mortgage lender. https://www.dfs.ny.gov/industry-guidance/industry-letters/20260422-nys-fair-lending-law
14 N.Y. State Dep’t of Fin. Servs., Report on Inquiry into Redlining in Buffalo, New York (Feb. 4, 2021), https://www.dfs.ny.gov/system/files/documents/2021/02/report_redlining_buffalo_ny_20210204_1.pdf
15 In this context a peer institution is a competing financial institution or a group of similar lenders operating in the same geographic market (e.g., Metropolitan Statistical Area) whose mortgage lending patterns match the scale of the subject lender’s volume. See for example, the National Fair Housing Alliance’s (NFHA) “Redlining Toolkit,” April 2022, https://nationalfairhousing.org/wp-content/uploads/2022/03/NFHA-Redlining-Toolkit-April-2022.pdf.
16 A majority-minority neighborhood is defined as a “Majority Minority Census Tract” (MMCT) if the population of the relevant minority group is greater than 50% of the total tract population (Black/Hispanic or All Minority).
17 Majority Black-Hispanic (MBH) tracts are defined as the census tracts where the combined population of residents who identify as Black or African American and/or Hispanic or Latino exceeds 50% of the total population.
18 Fideres’s own calculations from HMDA and Census ACS 2019-2023 five-year estimates.
19 Public HMDA loan amounts are disclosed as the midpoint of a $10,000 range, so the dollar volume is approximate by construction.
20 The term “depository institution” means any bank or savings association.” https://www.fdic.gov/federal-deposit-insurance-act/section-3-definitions
21 Corresponds to the eleven-county core of the same MSA.
22 Specifically, we only consider conventional home purchase applications (i.e., closed-end, first-lien, site-built, owner-occupied).
23 Shortfall arithmetic: peer-average MBH share (23.36%) × lender originations (2,517) = 588 expected, minus 254 actual = 334. Peer counts and percentiles: 94 of 109 peers higher is approximately the 13.8th percentile.
24 This gap persists when records without reported race/ethnicity are excluded. It is also persistent in other markets where the same bank operates